Fund Overview
The Covered Bridge Fund was created with the goal of reducing risk during equity market volatility and extending income opportunities for investors.
At A Glance
-
Minimum Investment
$100,000 -
Investment Style
Large Value -
Category
Options-based -
Share Class Inception Date
10/01/13 -
Total Fund Net Assets as of 3/31/2026
$113 Million -
3 Yr Return as of 3/31/2026
8.59% -
5 Yr Return as of 3/31/2026
6.60% -
10 Yr Return as of 3/31/2026
7.67%
-
Minimum Investment
$2,500 -
Investment Style
Large Value -
Category
Options-based -
Share Class Inception Date
10/01/13 -
Total Fund Assets as of 3/31/2026
$113 Million -
3 Yr Return as of 3/31/2026
8.31% -
5 Yr Return as of 3/31/2026
6.34% -
10 Yr Return as of 3/31/2026
7.40%
Annual Principal Value and Payout
As of 3/31/2026
| Ending Principal | Payout | Cumulative Payout | |
| 2014 | 102,200 | 11,234 | 11,234 |
| 2015 | 93,800 | 5,330 | 16,564 |
| 2016 | 99,000 | 7,242 | 23,806 |
| 2017 | 101,100 | 7,687 | 31,493 |
| 2018 | 87,500 | 10,104 | 41,597 |
| 2019 | 96,900 | 6,391 | 47,988 |
| 2020 | 90,300 | 4,248 | 52,236 |
| 2021 | 100,500 | 7,581 | 59,817 |
| 2022 | 92,900 | 8,071 | 67,888 |
| 2023 | 89,800 | 7,907 | 75,795 |
| 2024 | 87,000 | 7,875 | 83,670 |
| 2025 | 90,200 | 7,434 | 91,104 |
| YTD 2026 | 90,300 | 2,052 | 93,156 |
Simple Average of Annual Payout (2014-2025)= $7,592
Starting in 2018, the fund transitioned from distributing capital gains annually to distributing capital gains on a quarterly basis.
Dividends and/or distributions are not guaranteed. The covered calls may not be suitable for all investors and are subject to the loss of principal.
Top 10 Equity Holdings
as of 3/31/2026
| Net Asset % | |
| Microsoft | 4.58% |
| Pfizer | 2.86% |
| Verizon | 2.71% |
| Intel | 2.58% |
| Accenture | 2.46% |
| United Parcel Service | 2.44% |
| Disney | 2.13% |
| Dominion Energy | 2.13% |
| JPMorgan Chase | 2.08% |
| McDonald’s | 2.06% |
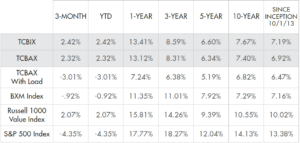
Investment Performance
as of 3/31/2026